A RIPPLE EFFECT INITIATIVE
Clear water.
Look closer.
Explore water measurements and their sources.
Move across the particles, or tap a form to highlight it.
Browse water utilities
Try a popular ZIP code or search by utility name, city, or state.
Particle atlas
Compare particle forms
Three forms to explore.
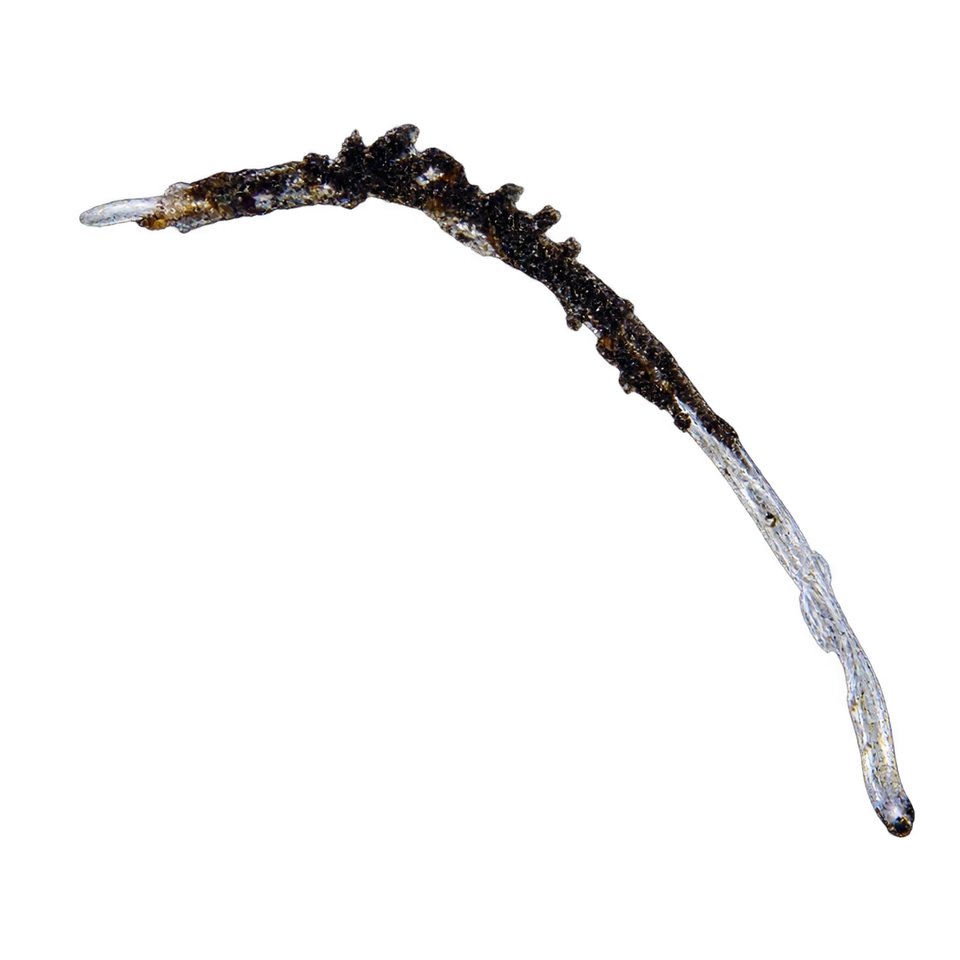
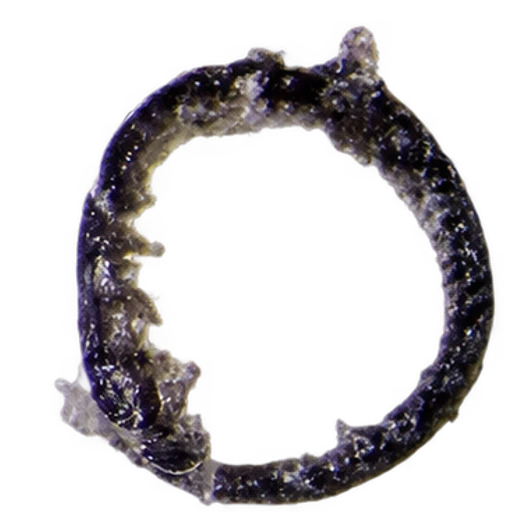
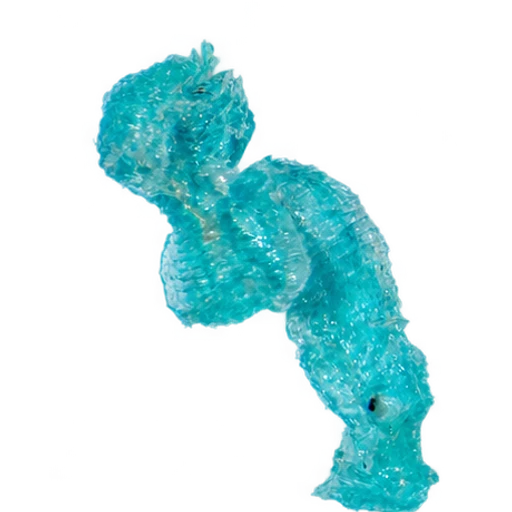
Fibers
Long, fine strands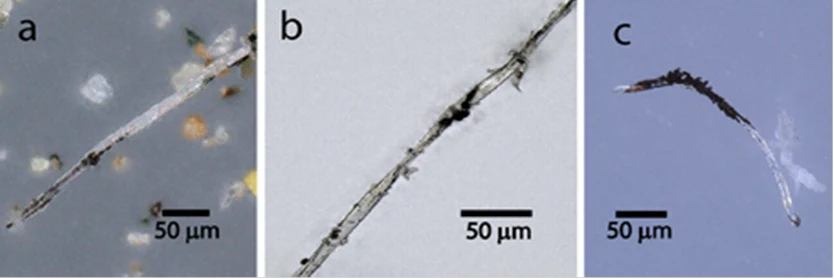
Fibers from snow (a), a road surface (b), and a shredded tire (c). Dark deposits are interpreted as tire matter.
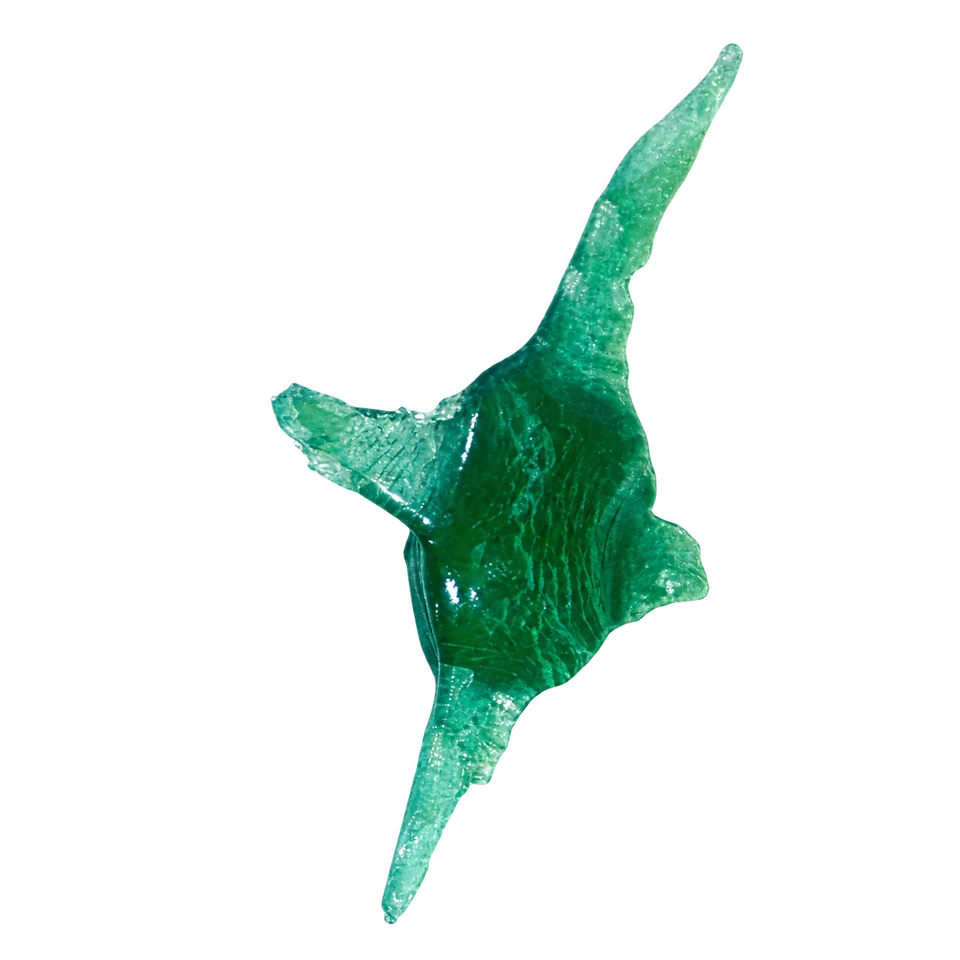
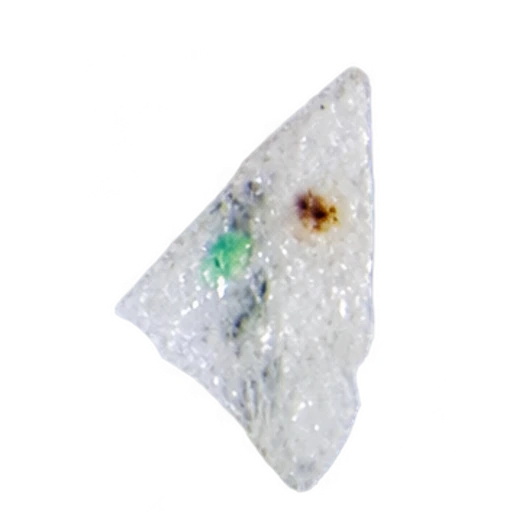
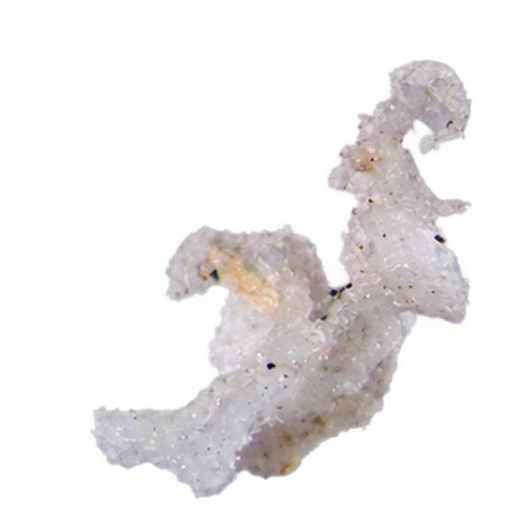
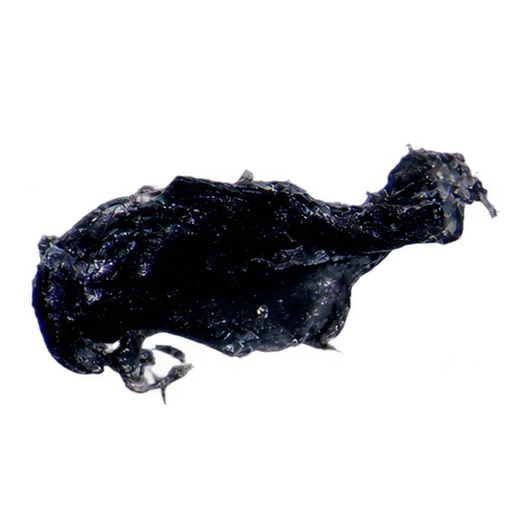
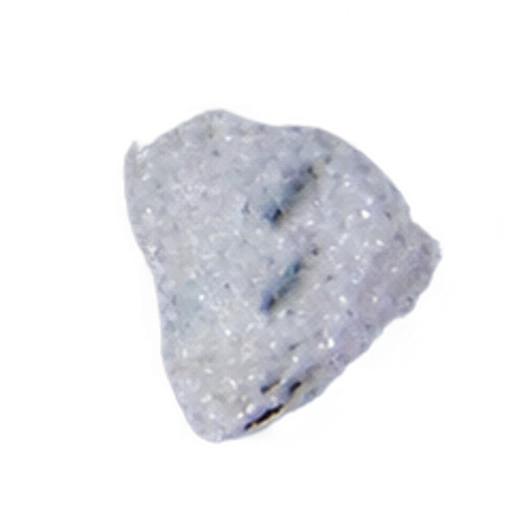
Fragments
Irregular flakes and chips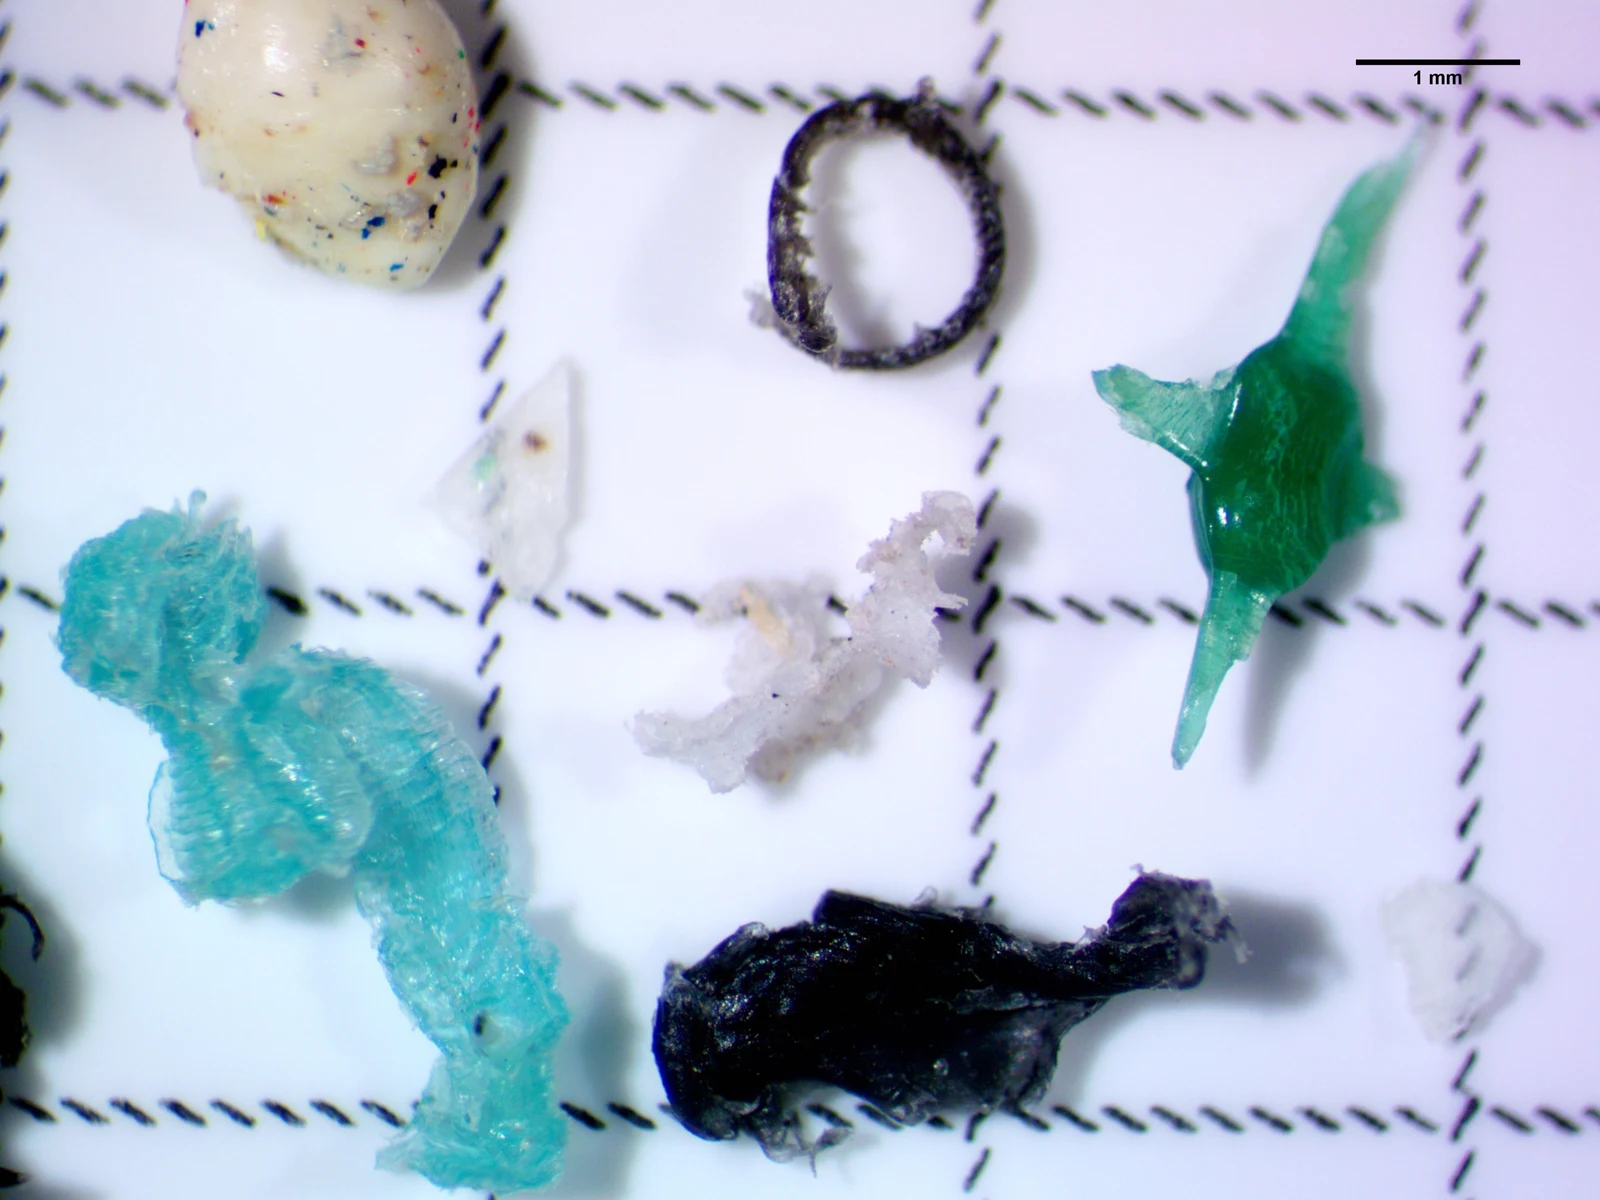
Microplastic fragments under a microscope.
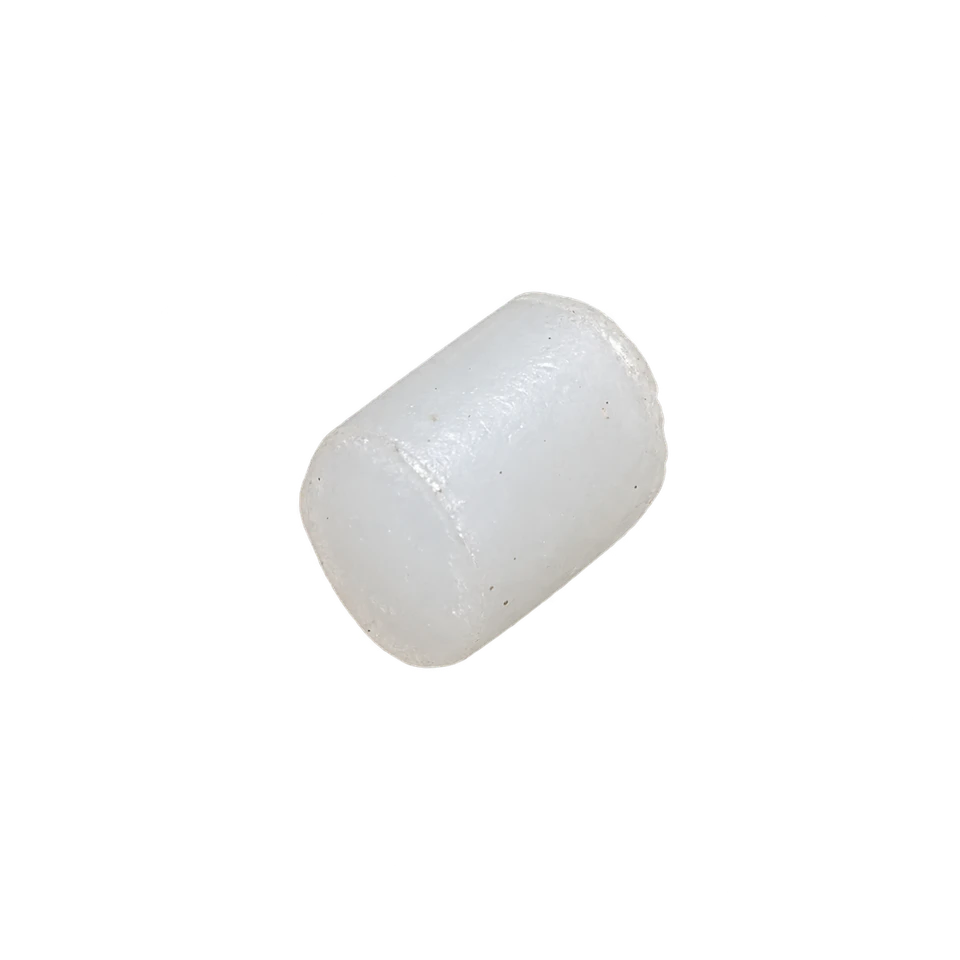
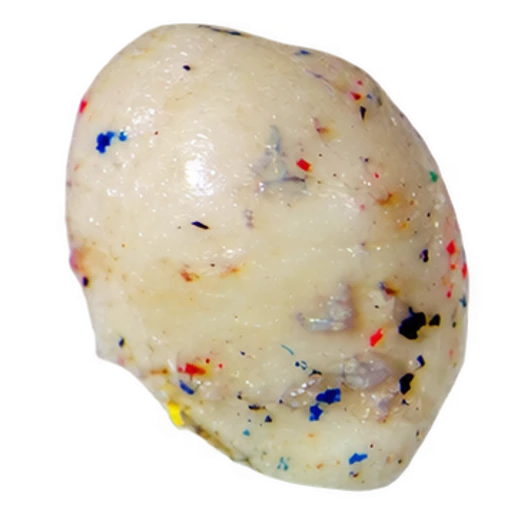
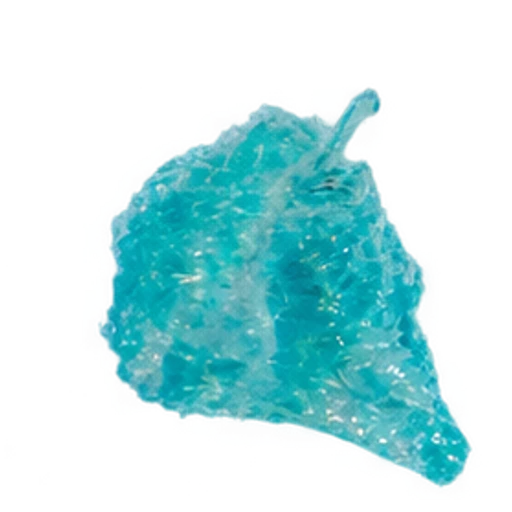
Granules
Compact, rounded pieces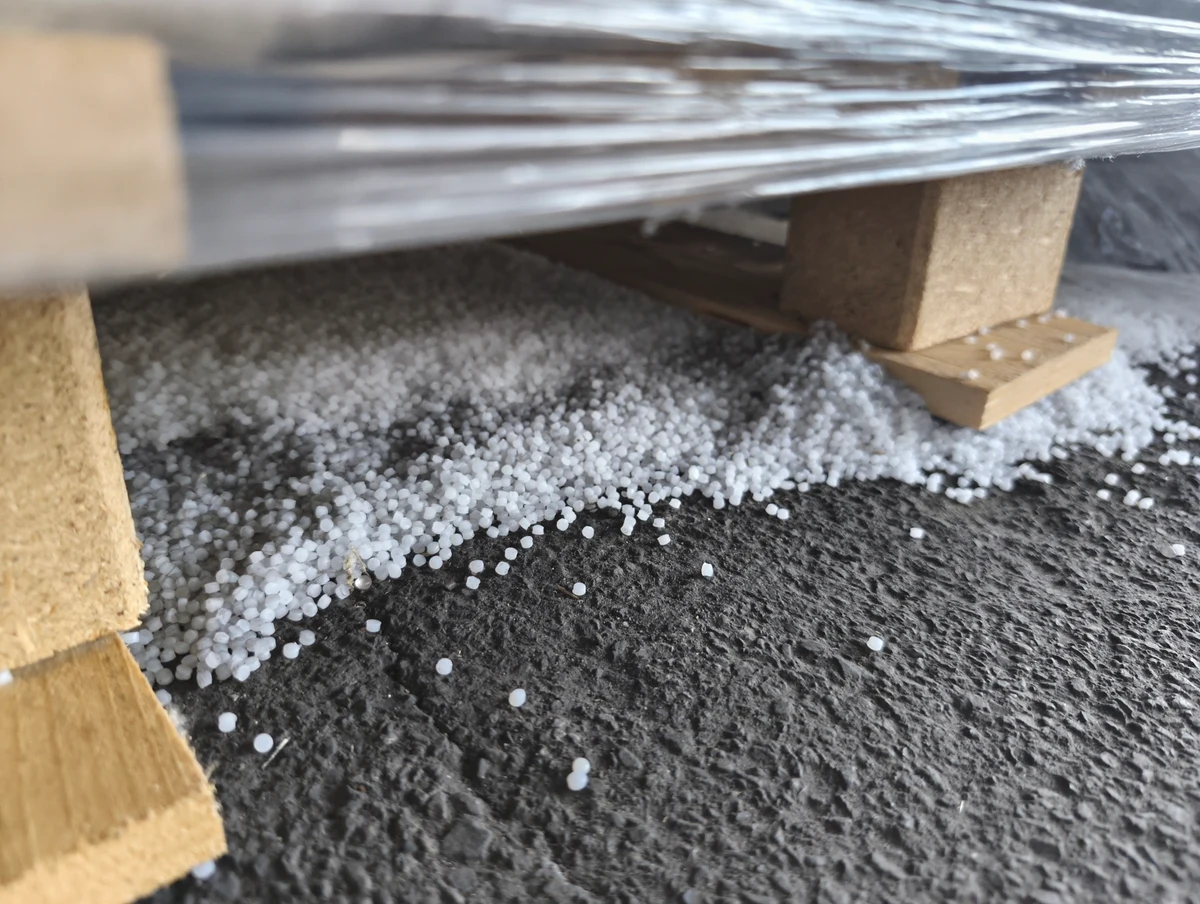
Spilled plastic pellets, photographed at an industrial site.
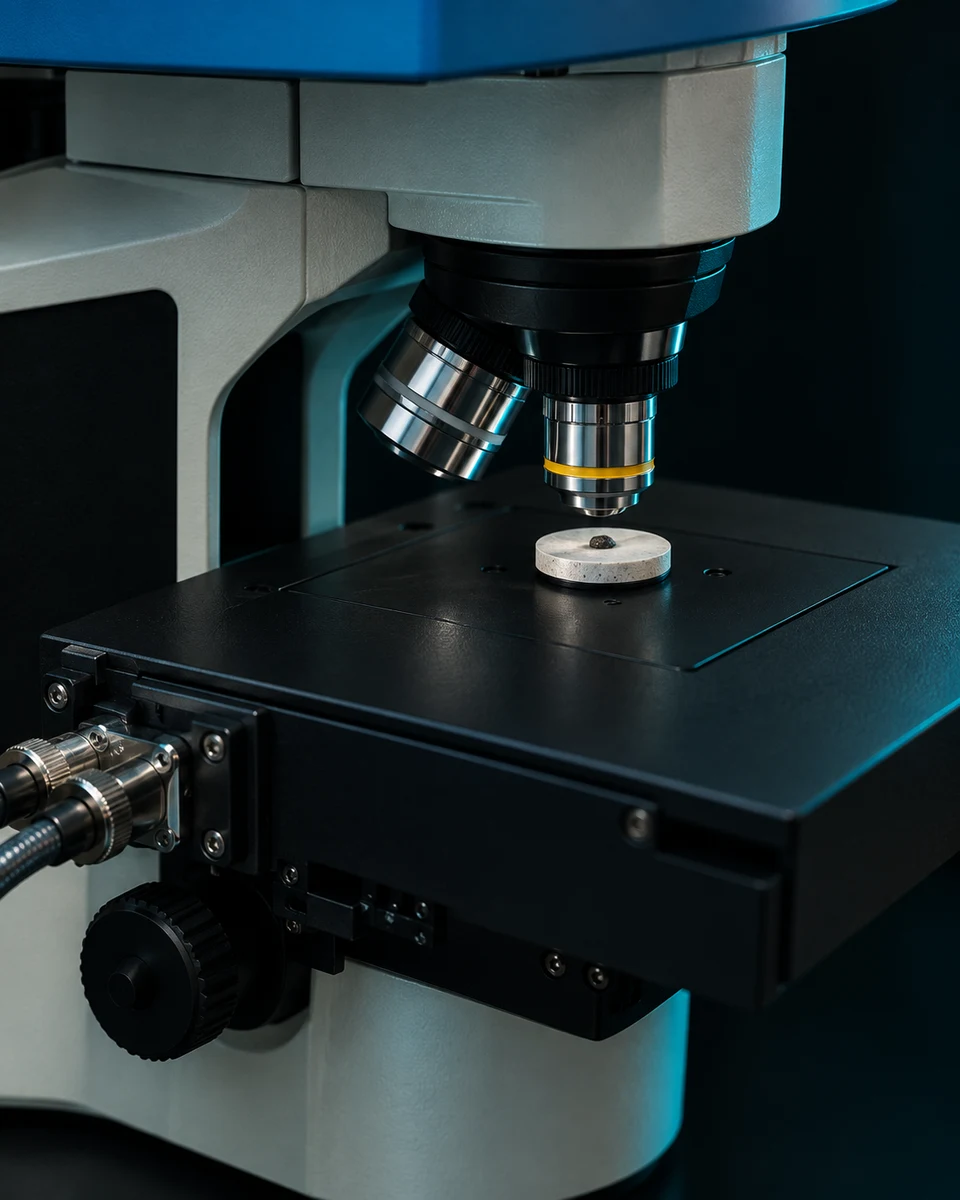
Jamie Velkoverh / USGS · Public domain
From image to evidence
Sample examination
A useful result connects a sample, a method and a source.
- Sample
- Where the water came from and when it was collected.
- Method
- How it was examined and what was measured.
- Result
- The reported value, units, source, and limitations.
Research context
Inside a bottled-water study
Bottled-water study · 2024
One liter. Three bottled-water brands. A closer look at what that study found.
About 90% were nanoplastics.
The remaining share were larger microplastics. Each mark represents about 1% of the study total—not an individual particle.
Published research, not a live reading or a measurement of your water.
The study examined three bottled-water brands. About 90% of the detected particles were nanoplastics.
Study scope
This average describes the tested brands, not your water. Particle counts varied; health effects remain under investigation.
Community observations
Contribute a reading
Have a water reading? Include the source, collection location, date, method, and units so someone else can understand the result.
Citizen readings stay separate from reviewed utility measurements.
Contribute a reading Explore existing water dataFictional system levels demonstrate a comparison scale. They are not utility readings, current regulatory guidance, or safety findings.
PFOA / PFAS (Forever Chemicals)
pptModel units: ppt. Values below are examples, not a concentration for your water.
The same value can sit above one benchmark and below another. A missing benchmark remains unavailable; it is not zero and does not establish safety.
Recent activity
loading…Get water alerts
Enter your ZIP and email. We'll notify you when new contaminant data is published for your area, especially if levels exceed health guidelines.
Recently added utilities
Read the evidence label
Source and review status show what evidence supports each record. Missing review or benchmark data remains unassessed; check the method, units, collection date, and source before interpreting a result.
Citizen readings
Community-submitted measurements from volunteers using the microplastics identifier.
Support the microplastics identifier
Review the fieldwork plan, funding source, and ways to contribute.